.jpeg)
Optical Density at 600 nm (OD600 or simply OD) is a standard method for estimating microbial cell density. If you are conducting R&D or manufacturing across multiple sites or using multiple instruments within a site, make sure you understand the natural variance in OD and develop a plan to normalize the data.
OD is consistent on any given instrument, but it is notoriously inconsistent across instruments. If you take the same sample and measure OD on two different instruments you may get very different results. When we internally tested the same sample on two different instruments, 16 out of 25 OD measurements differed by 30% or more.
Cell density is often used as a critical checkpoint in fermentation processes, and OD is the go-to analytical method because it is simple and quick. For example, OD is frequently used to determine when a shake flask is ready to be transferred, when to start induction, or when to harvest. Given the criticality of these decisions, it is important to know how OD = 10 on instrument A compares to OD = 10 on instrument B.
Imagine that you developed a robust process in your lab and you are running a tech transfer batch at a new CDMO. You instruct the CDMO to inoculate when OD = 10 in the shake flask, but neither party confirmed how the OD in your lab compares to the OD at the CDMO.
The CDMO inoculates when OD = 10 on their spectrophotometer, but that same sample would have read OD = 7 on your spectrophotometer. Even if everything else is perfect, you have a source of hidden variability that will be very difficult to track down.
Then, when the tech transfer batch starts missing expected endpoints, you and your CDMO will both wonder what happened. Was the given process not as robust as you thought? Did the CDMO make a mistake? Who or what is responsible for this?
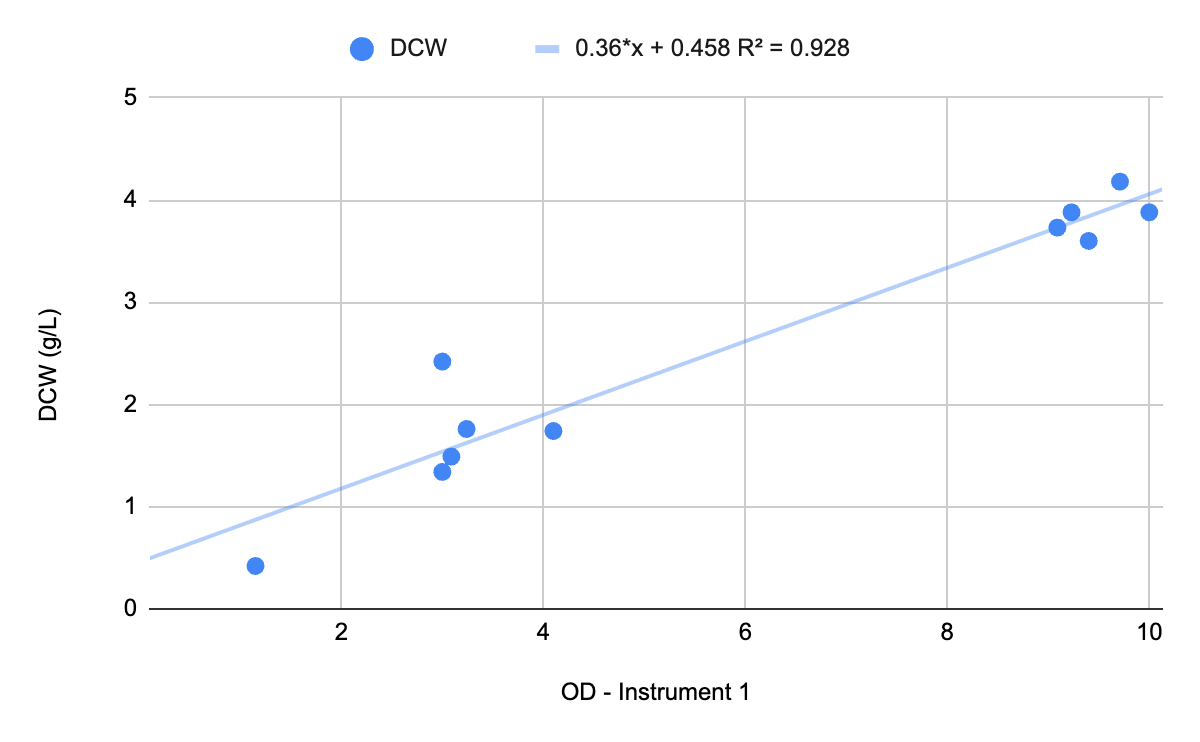
To ensure consistent performance and actionable data, Growth Curve Bio frequently recommends measuring OD in addition to dry cell weight (DCW) and/or wet cell weight (WCW), at least in the early stages of a project. By measuring OD, DCW, and WCW at the client’s site and our site, we can build a calibration curve to compare OD across sites.
DCW is the “gold standard” method for correlating OD to biomass. It is useful for establishing the calibration curve to compare OD across sites but it is not useful as a real-time, during-the-batch result. Why? It requires drying, which takes time. By the time you dry your sample the culture changes considerably and you will miss your window to inoculate, induce, harvest, etc. Therefore, use DCW on the front end to calibrate two instruments to the same physical reality.
WCW is another method for correlating OD to biomass, although it is less reliable than DCW. It is less reliable because the amount of liquid trapped between the cells varies based on the physical characteristics and operating parameters of the centrifuge, and the water-to-biomass ratio changes over time as cells grow. Therefore, you should not build a calibration curve based on WCW. Because no drying is required, WCW is a relatively quick and easy measurement, so it could be used in conjunction with OD as a real-time double-check for critical decisions while a batch is running.
Chart 1: OD - Instrument 2 vs. OD - Instrument 1
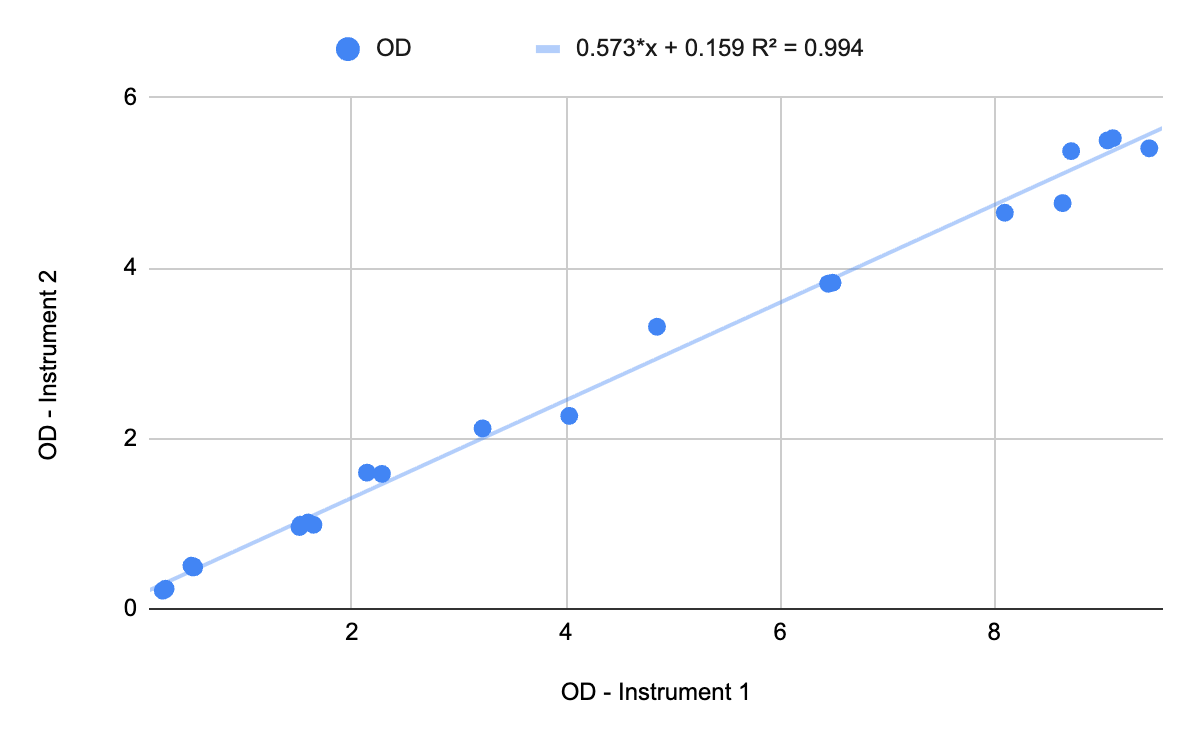
Chart 2: WCW vs. OD - Instrument 1
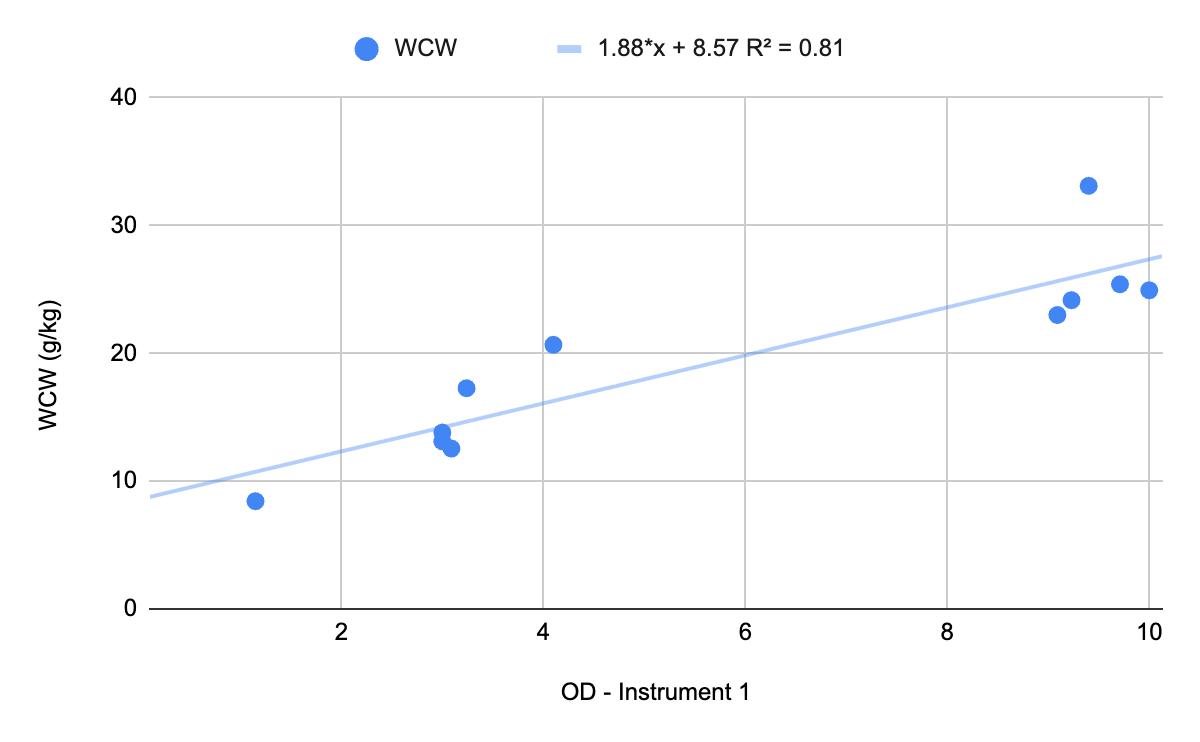
Chart 3: DCW vs. OD - Instrument 1